As the North Bay fires burned more than 100,000 acres over the course of a few weeks last October, 100 miles south, in Santa Clara, Sutter Health pediatrician Manisha Panchal was stunned at the number of patients coming to her with coughs and bronchospasms — even children who had never wheezed before.
During the fires, the entire Bay Area got a taste of what it’s like to walk around during a high pollution day in Beijing, China. The fires released as much pollution into the air as a full year of cars on California roads.
But on a typical day in the Bay Area, air quality is not top of mind for most locals. “It comes out when there’s the wildfires,” said Panchal, “and then it goes away, and people forget.”
As climate change continues, wildfires could become the “new normal” for California, Governor Jerry Brown warned last year. Despite the strides California policymakers have made to reduce emissions, this natural phenomenon will contribute to climate change and short-term air pollution. However, it’s not the only concern state officials have about air quality.
While California holds a reputation as a leader in environmental policy, it still ranks worst out of all 50 states for average public exposure to particulate matter pollution — largely due to the state’s topography and population density. California is also home to eight of the 10 U.S. metropolitan areas with the highest year-round concentration of particulate matter. In 2018, the Bay Area ranked sixth on the list, above the notoriously polluted Los Angeles-Long Beach area.
And though overall air quality statewide is improving, there are communities where pollution levels are the same or worse, University of Southern California lung health expert Ed Avol said.
“It seems like it would be a contradiction, but in fact that is what is happening.”
Today, understanding air quality at a hyperlocal level is a major challenge for both local residents and public officials. Data monitoring stations are spaced far apart, taking regional air measurements that differ drastically from what an individual may be actually breathing at any given time. As population and traffic congestion in the Bay Area grow, existing infrastructure keeps many local schools and athletic facilities a stone’s throw from emissions-heavy freeway routes. And as has been well-documented, low-income areas and communities of color face stronger impacts from polluted air.
The State of Bay Area Air
At first glance, it seems as if local air pollution should be on the rise. Between 1970 and 2010, the population of the Bay Area jumped from 4.6 million to 7.2 million, according to census data. Except for a dip during the 2008 recession, vehicle miles traveled in California tripled from 1972 to 2016, California Department Motor Vehicles shows. And in the nine-county region, Santa Clara County tops the list for highest number of vehicle miles traveled – 42.8 million miles in 2015.
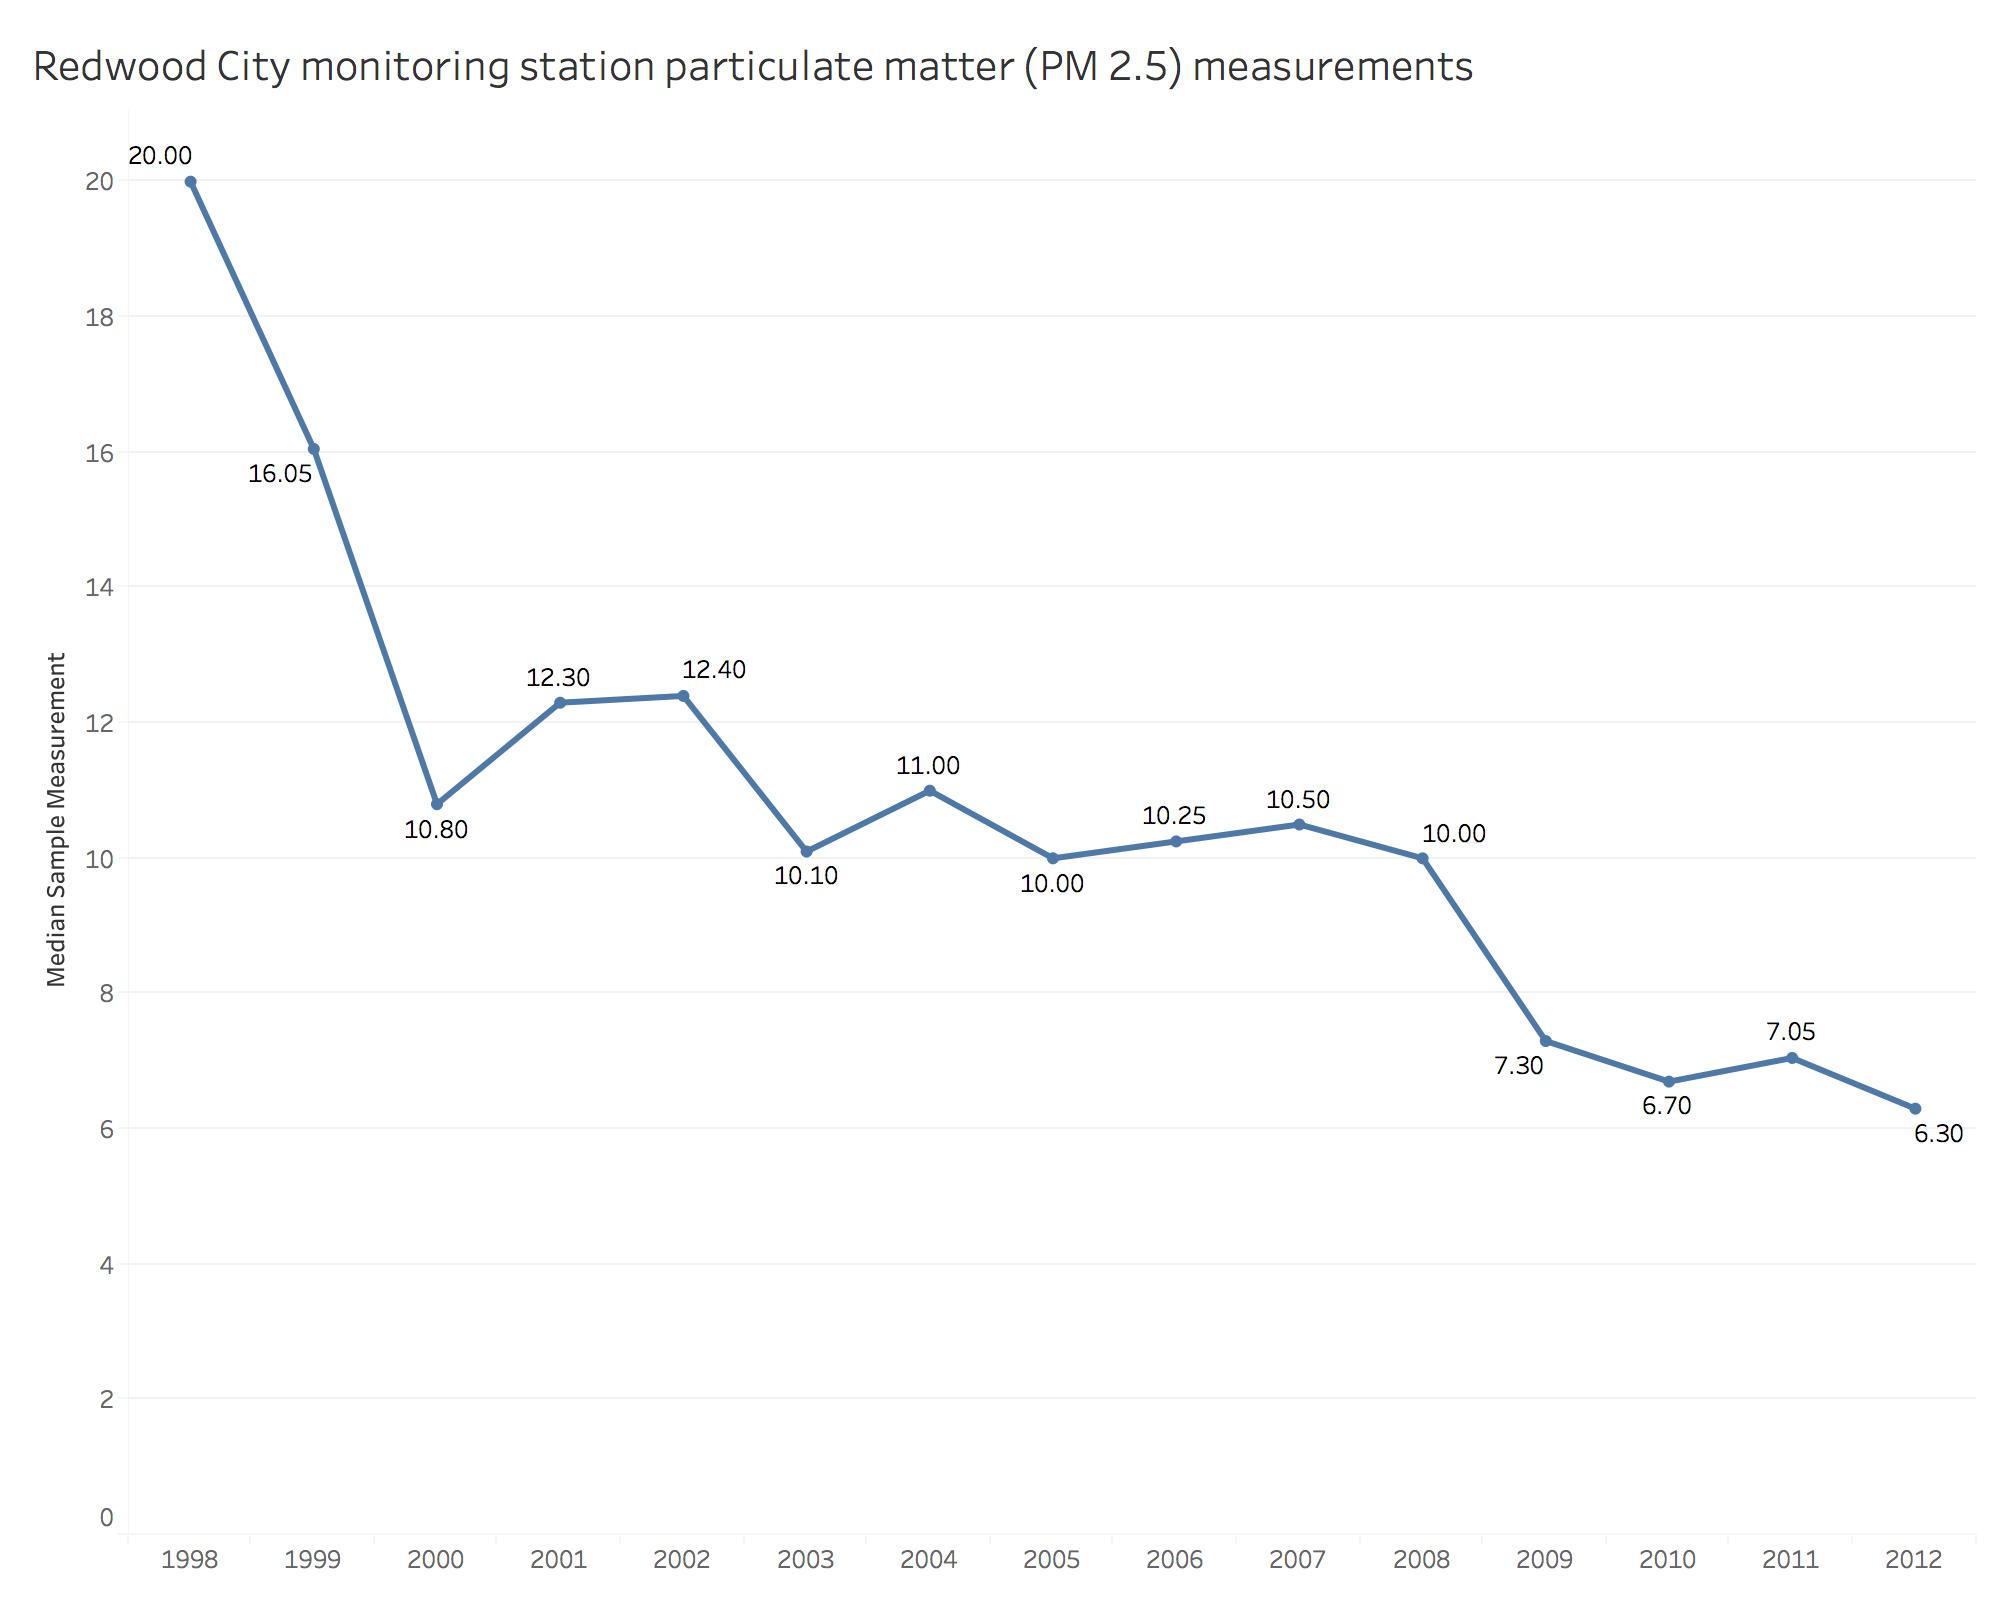
Despite that increase in vehicle trips, stricter industrial emissions rules and more fuel efficient cars actually led to decreases in regional concentrations of particulate matter — tiny particles measured in microns, a millionth of a meter, said Eric Stevenson, director of meteorology and measurements at the Bay Area air district.
Still, the gains have not been enough to prevent illness or even pollution-related deaths. A 2013 study by Massachusetts Institute of Technology researchers found that 21,000 people die early each year in California from air pollution-related causes, mostly from vehicle, commercial and residential emissions. And while at the regional level, air quality is improving, pollution can vary greatly from neighborhood to neighborhood.
Lower income communities tend to concentrate in industrial centers or near freeways where rents are more affordable, Avol said. “They get overexposed because we can afford to live in a more desirable place, and this becomes an issue of environmental justice, environmental racism.”
To be sure, air quality in many areas around the world is far worse than it is in the Bay Area. Cities like Beijing and New Delhi rank far higher in pollution measures on a daily basis. But the issue is worth working on locally because today’s levels still produce negative health effects, researchers say.
“We should not be thinking, ‘If we get to this one level everything will be fine,’” said Avol. “There is no threshold, there is no safe line.”
Filling in the Data Gap
On an average day, a Bay Area resident who looks at the Environmental Protection Agency’s AirNow air quality website sees nothing to be concerned about. Many regions, like the entire Peninsula region or the Santa Cruz mountains, look clear or have yellow shading over them, indicating moderate air pollution. On rare occasions a region may turn orange, signifying the area’s air is unhealthy for sensitive groups like asthmatics.
But a different live map, maintained by startup PurpleAir, paints a more nuanced picture. The Utah startup has sold more than 1,000 sensors and posts air quality data collected by its devices online. Each point on the map is a particular sensor that uses the same metrics and color-coding as the AirNow system.
Just within the city of San Francisco, a viewer can often see map points that are green and healthy a few streets from other sensors color coded yellow, orange or even red for unhealthy. Both startups like PurpleAir and public agencies are trying to create granular air monitoring networks like this to better inform locals about the quality of the air they breathe.
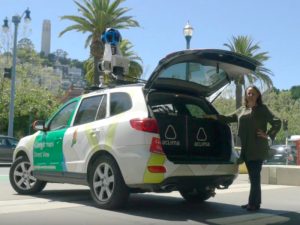
San Francisco-based Aclima is a startup that says it’s “filling in the pixels” on air pollution data by collecting street-level measurements. Aclima works with companies like Google and researchers and public agencies like the EPA to measure air quality. The company drove two Google Street View cars, mounted with an air monitoring sensor the size of two shoeboxes, more than 100,000 miles across California. The sensors collected a billion data points over two years, according to vice president of communications Kim Hunter.
The company’s street-by-street visualization of Oakland shows hotspots of pollutants near the Port of Oakland, as well as on interstate 880 and other major roads. Pollution can increase by five to eight times from one end of a block to another, said the company’s chief scientist Melissa Lunden.
These variations can depend on factors less obvious than proximity to roadways or factories. Subtle features can make a difference, like wind patterns, the presence of trees between roads and residences and whether freeways are at ground level or elevated. Aclima says its granular data could help buildings and cities make informed decisions about emissions exposure.
Recent advances in sensor technology allow startups to develop cheaper, portable devices that could allow monitoring agencies to expand their data collection, said the company’s chief scientist Melissa Lunden. The sensor Aclima is developing costs “100 to 1,000” times less than the equipment currently used by researchers and officials.
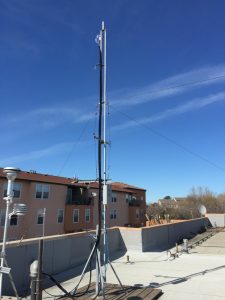
Installing a full Bay Area Air Quality Management District monitoring station costs around $250,000 and require more than half a full-time employee’s work hours to operate, said Stevenson. Since it’s such a large investment, he said the district sites most stations to represent very large geographical areas.
The district currently runs 33 air monitoring stations in the region to measure ambient air quality for that area. Just four of the seven stations between Redwood City and Gilroy measure particulate matter.
“I think it’s a failing of the air districts, and the state government which doesn’t require the air districts to do more,” said Bill Magavern, policy director at the Coalition for Clean Air.
Magavern says the air monitoring network does what’s required to comply with EPA rules about pollutant reporting, but this level of monitoring does not capture important neighborhood-level data.
His coalition has begun a project to install cheaper, portable monitors at schools and residences in the Los Angeles area. Once communities and government officials have a better understanding of hyperlocal air data, they can begin taking action to mitigate pollution.
California is now making strides to collect this kind of data on more narrow pockets of the state. The aim: for all residents to be breathing the same quality air.
Getting Down to the Neighborhood Level
Growing up in Bell Gardens, a city in Los Angeles County, state assembly member Cristina Garcia saw truck and freight traffic from the Port of Long Beach go by every day, spewing pollution into the air. Six freeways and a rail yard “choke my community,” she said.
Garcia noticed that districts like hers — working-class areas, communities of color, were often located in regions with poorer air quality. This experience prompted Garcia to take up the cause of environmental justice as a state legislator.
“My community has been treated like a wasteland,” she said. Garcia always heard that as the environment of California improved overall, her district would catch up, too. But she wasn’t seeing the results: “We’ve been calling it trickle down environmentalism for a few years now.”
So Garcia proposed AB 617, a regulation that mandates local air districts identify disadvantaged communities in each region for closer monitoring. The districts must then implement action plans to decrease pollution in those specific areas.
The bill passed last year, and local air districts must identify the first target communities by July 31. Garcia said she expects some positive results in air quality by 2023.
For now, the Bay Area air district is looking primarily at West Oakland as a site for action plans to reduce emissions, and at Richmond as a site for additional air monitoring. The Port of Oakland and highway traffic are major emitters for the region.
“The important thing is that we protect the health of every resident of the Bay Area…so getting down to the local level excites us,” Stevenson said. “No one else is doing this — no one else in the country.”
On a recent Wednesday night in Richmond, around 60 community members gathered to discuss the air district’s plans for additional air monitoring in the city. Representatives from Chevron, local residents and the district supervisor were present to hear Stevenson and other air district officials describe monitoring plans. Most wanted to know how soon the Richmond community will start to see results.
“These are human rights violations when you’re talking about disproportionate impact,” Henry Clark, executive director of the advocacy group West County Toxics Coalition, at the meeting. The air district responded to community concerns about whether monitoring data would be easily accessible online, and that the data would lead to action.
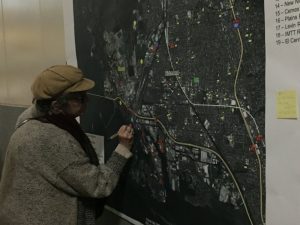
In an effort to include local residents in the monitoring process, the air district asked attendees to suggest potential sites for placing new air monitors. They could out fill a form online, or place a neon sticker on a large map of Richmond pinned to the wall.
“I put a dot where I live at the top of the hill,” said attendee Lori Goldwin, a resident of Point Richmond. In the past six months, she’s started to notice odors from polluted air in her neighborhood. “I’m getting more concerned about the toxic materials in the air,” she said.
Goldwin keeps an eye on air pollution and health impacts from discussions on the neighborhood network NextDoor. When she smells polluted air, she calls the air board’s air pollution complaint hotline and closes her windows.
“Maybe I’ll be run out of town by this,” she said. “I don’t want to move, but I could move.”
Risks to Young Lungs
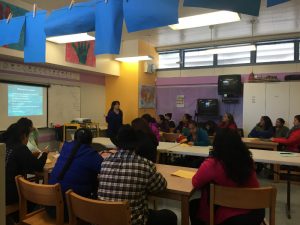
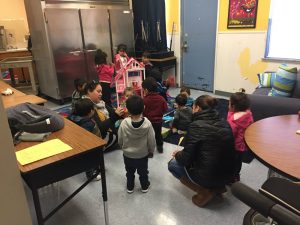
In a classroom at Redwood City’s Fair Oaks Elementary School, a group of 30 parents gathered to hear a Tuesday morning presentation on healthy lungs. Most had their toddlers in tow as they listened to Maria Elena Alioto, a representative for the nonprofit Breathe California, explain in Spanish how pollutants and allergens in the air can cause health issues in children and adults.
Attendee Cecilia Argumedo’s two-year-old grandson has asthma-like symptoms. When there’s pollution in the air, “he is choking constantly. He often stops breathing and that scares us a lot,” she said in Spanish. The boy’s mother has to take time off work when he is sick. “It’s difficult,” she said.
The parents had questions about how to deal with air pollution sources in their immediate surroundings: whom to call to register an air pollution complaint, what to do about a neighbor who burns leaves, or other neighbors smoking cigarettes.
“A lot of the families don’t have that relationship with their doctors,” said Aurora Gallardo, who works for the nonprofit StarVista and organized the event. “They have all these questions in their minds.”
As California plows ahead on its environmental goals, doctors and researchers are warning that some communities are being left behind. Communities of color and low-income areas tend to be exposed to more pollution, and also are more vulnerable to health problems from polluted air, said California Air Resources Board lung researcher Barbara Weller.
Alameda and Contra Costa rank in the top dozen counties for per capita asthma rates in the state, California Environmental Health Tracking Program data shows. Though the rest of the Bay Area ranks much lower in comparison, experts are still concerned about health effects.
Children are more vulnerable to irritation from traffic and air pollution because their lungs are still developing, said Avol. And while children are exposed to air pollution at home, another major factor is the location of their schools. Weller said even in Bay Area where overall pollution is fairly low, having schools near traffic is associated with increased wheeze in children.
These schools are more prevalent in disadvantaged communities. Statewide, 58.7 percent of students were eligible for free or reduced price school lunches during the 2014-2015 school year. For schools located within 500 feet of major roads, that figure jumps to 67.2 percent. In Santa Clara and San Mateo counties, schools near major roads had a rate of 43.3 percent, compared to 36.6 percent at schools located away from major roads.
This interactive map shows all California schools based on a database from the Center for Public Integrity. The color of the school signifies whether it is near a busy road or not, and the size of the dot signifies what percent of students are on free or reduced lunch programs. Clicking on each data point shows the name of the school, the address, and the percent of students on free or reduced lunch.
A 2003 California guideline recommends that no new schools should be built within 500 feet of a major road or freeway. But while “it’s wonderful that new schools are sited away from traffic…a lot of schools were already built,” Weller said. California has more than 1,000 active public schools located within 500 feet of major roads – a third of which opened in 2004 or later, an analysis of data collected by the Center for Public Integrity shows.
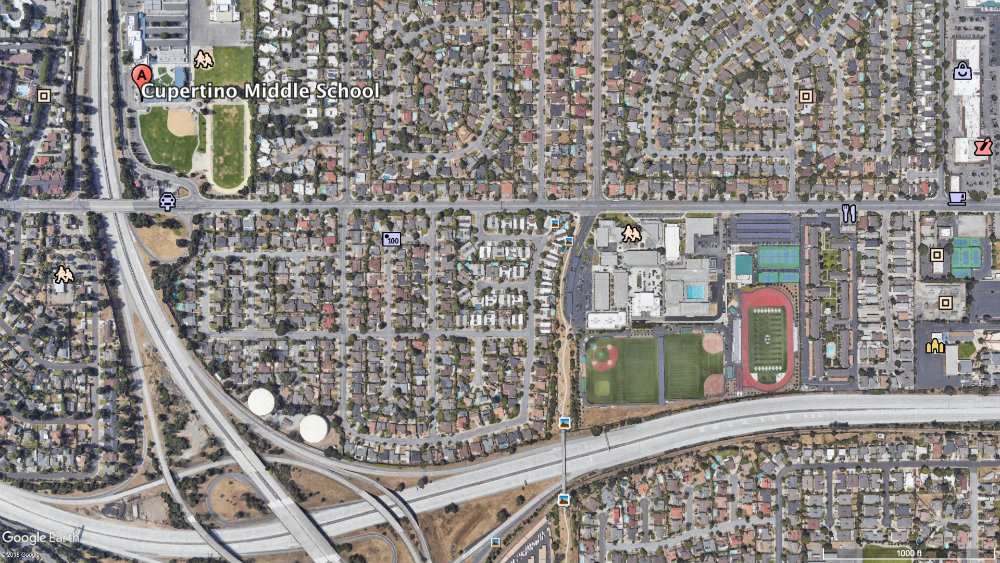
Dr. Panchal’s children attend one of those schools – Bullis Charter School in Los Altos, opened in 2004. She says the lunch tables are located right next to San Antonio Road, separated by a fence. “Why would they put the tables there?” she said. “For that one hour the kids are just breathing these particles.”
The air resources board says the layout of the campus makes a difference for students’ exposure levels to polluted air. Moving playgrounds, fields and other outdoor areas further from roads can lessen the health impacts of vehicle emissions. Parking lots or enclosed areas could border the road instead, Avol said.
Local air quality has been historically clean enough that school districts “haven’t really had to think about it,” Panchal said. “As population increases and cars increase it’s definitely a growing concern for us.”